Define
01Map the critical operational data sources and the exact decisions the dashboard is built to support.

Mighty Leap builds live dashboards that turn scattered metrics into a single, focused view, engineered for fast reading, fast decisions, and zero ambiguity.
We help businesses move beyond scattered spreadsheets and delayed updates by building dashboards that make performance easier to track, and easier to act on.
Strategic Approach
We design views that expose operational truth instantly, removing the opacity of delayed reporting and stale spreadsheets.

Most dashboards drown signal in volume. We strip away the metrics that don’t change behavior and elevate the ones that do.
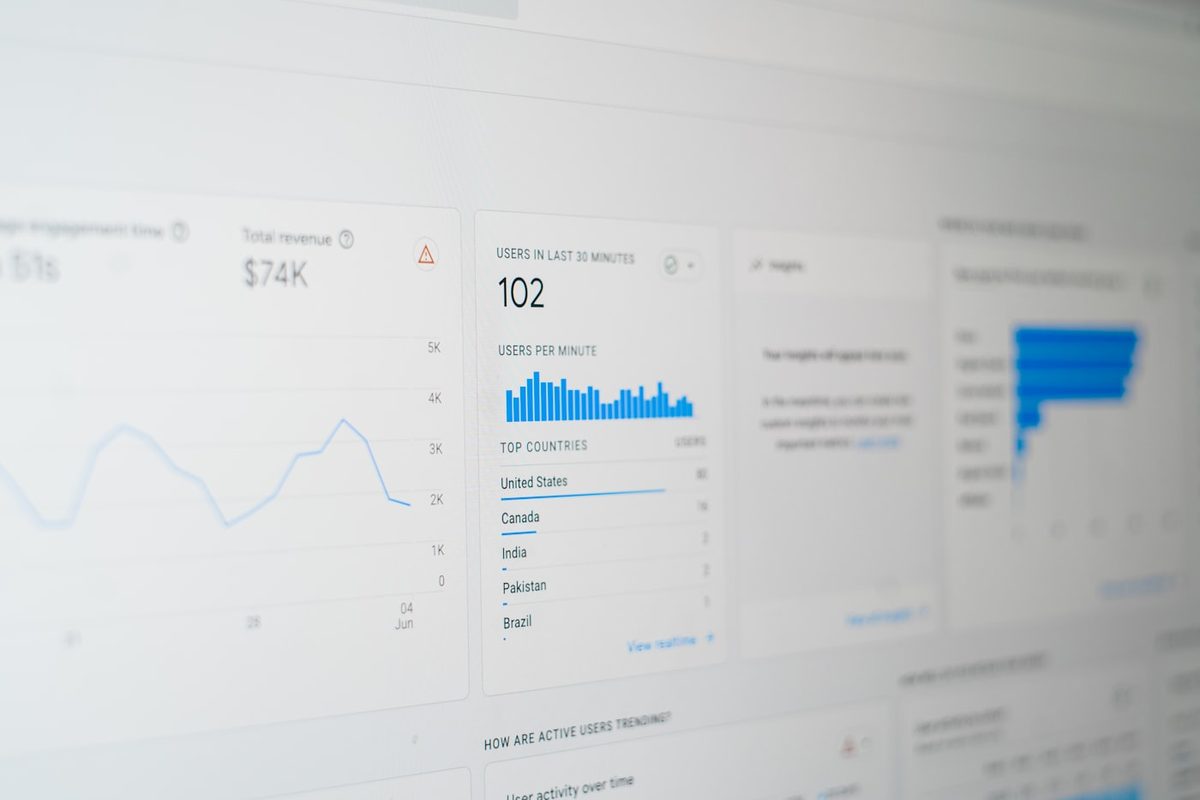
A dashboard is only valuable if it changes behavior. We embed alerting and recommended actions so the next step is built into the view.

Methodology
Every dashboard follows the same 5D process, so the architecture beneath the interface always displays the truth.
Map the critical operational data sources and the exact decisions the dashboard is built to support.
Structure raw data into categorized, meaningful KPIs and design an interface built around who reads it.
Build the dashboard and the logic beneath it so every number stays accurate, live, and trustworthy.
Launch with thresholds and alerts that proactively notify teams the moment a metric deviates.
Embed decision logic and track adoption so every view leads a team straight to the next action.
Core Capabilities
Live dashboards help businesses move beyond delayed reporting by making performance easier to monitor, issues easier to spot, and decisions easier to support in real time.
FAQs
Common questions about live dashboards at Mighty Leap.
A live dashboard brings your key metrics into one always-current view, with real-time KPIs, custom views, and drill-down, so everyone reads the same numbers instead of chasing scattered reports.
We connect dashboards to your existing sources, such as your CRM, analytics, spreadsheets, and databases, and keep them refreshed automatically so the view stays current.
Yes. We design custom views so each team sees the metrics that matter to them, with the ability to drill down from a headline number into the detail behind it.
Monthly reports look backward and arrive late. A live dashboard updates continuously, so you spot changes and act while they still matter, not weeks afterward.